- Development & IT
- Programming Languages
- Open Flash Chart
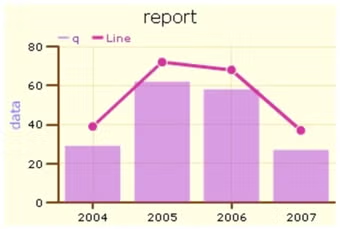
Open Flash Chart was designed to bring interactive data visualization to early web applications using Flash-based rendering, allowing developers to embed dynamic charts inside websites.
It helped users:
- Visualize data in web dashboards
- Create interactive reporting systems
- Display business metrics graphically
- Build early analytics platforms
- Enhance web-based data presentation
The software is historically popular among:
- Early web developers
- Enterprise dashboard builders (legacy systems)
- Educational tool developers
- Business reporting systems (old applications)
Today, it is largely replaced by modern JavaScript-based charting libraries.
📌 What is Open Flash Chart?
Open Flash Chart is an open-source charting library used to create interactive data visualizations such as graphs and charts using Adobe Flash technology (SWF-based rendering).
It was widely used in early web applications to display dynamic charts inside browsers before modern HTML5 charting tools became popular.
The software helps users:
- Create interactive charts and graphs
- Visualize data in web applications
- Display real-time or dynamic datasets
- Embed charts into websites
- Generate bar, line, pie, and area charts
- Customize chart appearance and animations
It is commonly used by:
- Web developers (legacy systems)
- Data visualization engineers (older projects)
- Business reporting tools (legacy dashboards)
- Educational software developers
- Enterprise web applications (historical systems)
The application mainly focuses on:
- Web-based data visualization
- Flash-based interactive charts
- Dynamic reporting dashboards
- Embedded analytics tools
- Client-side chart rendering
🚀 Key Uses
- Displaying business analytics dashboards
- Creating financial reports with graphs
- Visualizing website traffic data
- Building admin dashboards (legacy apps)
- Embedding charts in web portals
- Showing statistical trends
- Representing survey results visually
- Monitoring system performance metrics
- Creating interactive reporting tools
- Educational data visualization
💻 System Requirements (General)
Supported Platforms
- Web browsers supporting Adobe Flash Player (legacy)
Basic Requirements
- Adobe Flash Player plugin (required)
- Modern web browser (older versions)
- JavaScript support
- Web server for hosting charts
Recommended Requirements
- Server-side scripting support (PHP, etc.)
- Stable browser environment
- Legacy Flash-enabled system setup
⚠️ Important Note
Adobe Flash Player is now officially discontinued.
Because of this, Open Flash Chart is considered obsolete and is no longer recommended for modern development.
🔄 Alternatives
- Chart.js
- D3.js
- Google Charts
- Highcharts
- ApexCharts
- Plotly
- ECharts (Apache)
❓ FAQ
Q1. What is Open Flash Chart used for?
It is used to create interactive charts and graphs in web applications using Flash technology.
Q2. Is Open Flash Chart still used today?
No, it is mostly obsolete due to the end of Adobe Flash support.
Q3. Does it work in modern browsers?
No, modern browsers no longer support Flash content.
Q4. What replaced Open Flash Chart?
HTML5-based libraries like Chart.js and D3.js replaced it.
Q5. Is it open-source?
Yes, it was released as an open-source charting tool.
🔄 Best Alternatives
Features
✔ Flash-based interactive charts
✔ Multiple chart types (bar, line, pie, etc.)
✔ Dynamic data visualization
✔ Web embedding support
✔ Animated chart rendering
✔ Customizable chart styles
✔ Lightweight integration (for its time)
✔ Server-side data feeding support
✔ JSON/XML data compatibility
✔ Legacy dashboard support
✔ Basic interactivity features
✔ Browser-based rendering (Flash plugin required)
👍 Pros & 👎 Cons
Pros
- Was powerful for early web dashboards
- Easy embedding in websites (historically)
- Interactive and animated charts
- Simple integration with backend data
Cons
- Fully dependent on Adobe Flash (now discontinued)
- Not compatible with modern browsers
- No longer maintained
- Outdated technology
- Replaced by modern HTML5 tools
Expert Review
Open Flash Chart is a legacy visualization library that played an important role in early web analytics and dashboard systems but is now obsolete due to the end of Flash support and the rise of modern HTML5-based charting solutions.
Its strongest advantages (historically) were:
- Interactive chart rendering
- Easy web embedding (for its time)
- Dynamic data visualization
It is now only relevant for maintaining or studying legacy systems, while modern projects should use Chart.js, D3.js, or similar libraries.
How to Install
⚙️ Usage Guide (General Overview)
Step 1: Install Flash Environment (legacy only)
Requires older Flash-enabled setup.
Step 2: Include Library
Add Open Flash Chart files to project.
Step 3: Prepare Data
Format data in JSON/XML.
Step 4: Embed Chart
Insert SWF object into webpage.
Step 5: Load Data
Render chart dynamically.
Step 6: Display Results
View interactive visualization.
Apps Specs
Licence
Paid
Latest Update
June 24, 2026
Platform
Windows
Downloads
Devlopers
Top Downloads
Related Topics
Disclaimer
This content is provided for educational and informational purposes only. We do not host, store, or distribute any software files on our servers. All trademarks, product names, and logos belong to their respective owners.
We strongly recommend downloading software only from official websites or trusted sources. We are not responsible for any damage, data loss, or issues that may occur from the use of third-party software.
Users should ensure they comply with all applicable laws and software licensing agreements in their country before downloading or using any software mentioned on this website.
You may also like
Alternatives to
Expore Apps